AI ride feedback
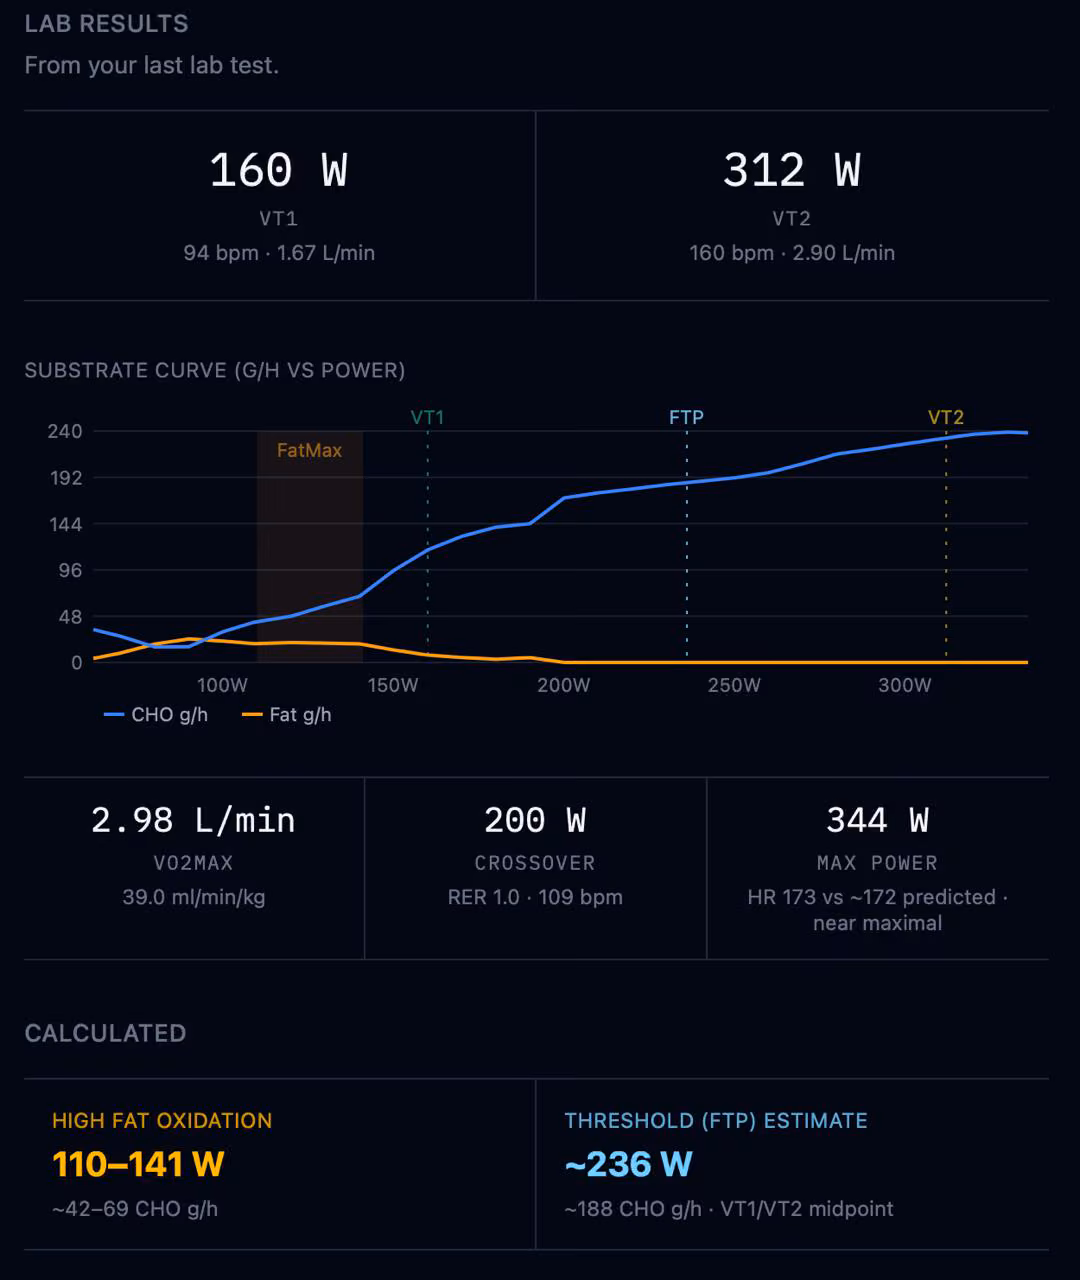
I got a CPET done (cardiopulmonary exercise test — you breathe into a mask on a bike, it measures your gas exchange) and walked out with a substrate curve — fat and carb burn at every wattage. My trainer helped me read it. But as a hobbyist, you don't have a trainer looking at every ride. I wanted tangible guidance on Tuesday's tempo session, not just the lab debrief. So I built something.
If you use Intervals.icu, you connect once and your rides are just there. It's free, not a walled garden, and I'd recommend the supporter plan. No affiliation, it's just that good.
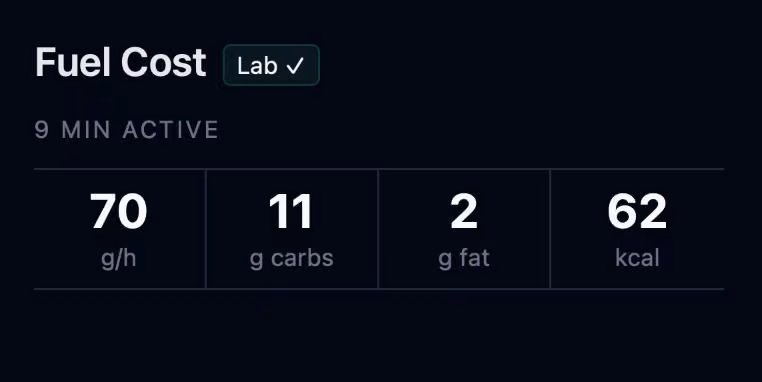
What rides.md adds: your lab test. A CPET gives you a substrate curve that shows exactly how many grams of carbs and fat your body burns at every wattage. rides.md takes that curve and overlays it on your ride. So instead of just seeing "NP 172W," you see "NP 172W = 120 g/h carb demand, 5 g/h fat." That's where fueling targets come from. Not from the internet. From your physiology.
That part worked. The interpretation was still on me.
One button
There's now a Get Feedback button on every ride. It sends your ride data to a model that has your substrate curve, your lab profile, your hourly splits, your power zones. Everything rides.md already calculated. The model reads it the way a physiologist would read a lab report.
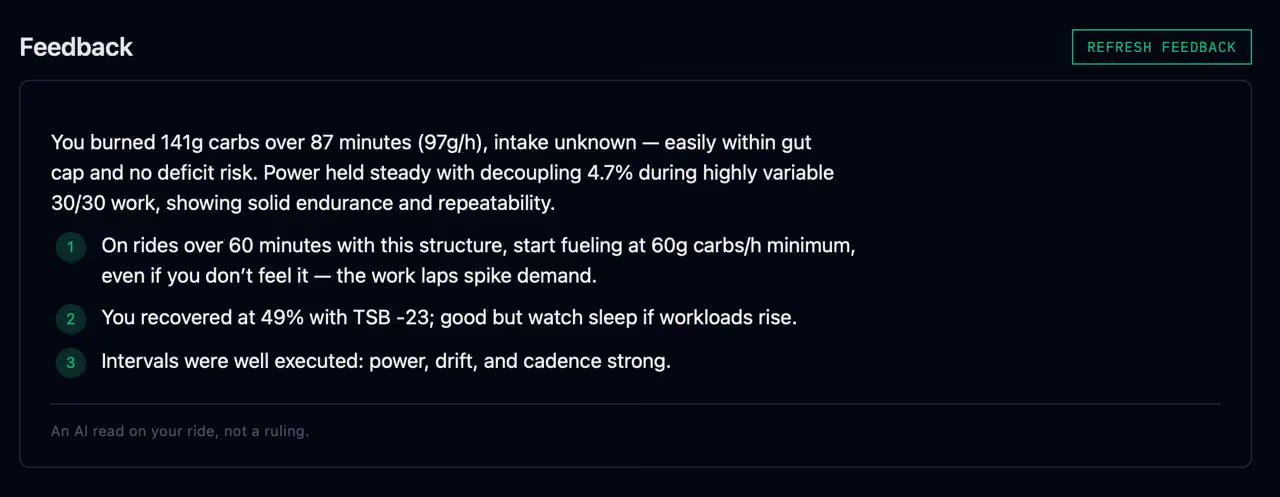
The output is short. Two sentences, three bullets, done. If the data says you nailed it, it says that. If you're burning 180 g/h and your gut absorbs 90, it tells you to eat from minute one.
The substrate curve is the difference
The substrate curve changes everything. At 150W, my curve says 88 g/h CHO and 13 g/h fat. At 170W, it's 120 g/h CHO and 5 g/h fat. That 20-watt difference is the difference between a manageable ride and a glycogen crisis on anything over three hours.
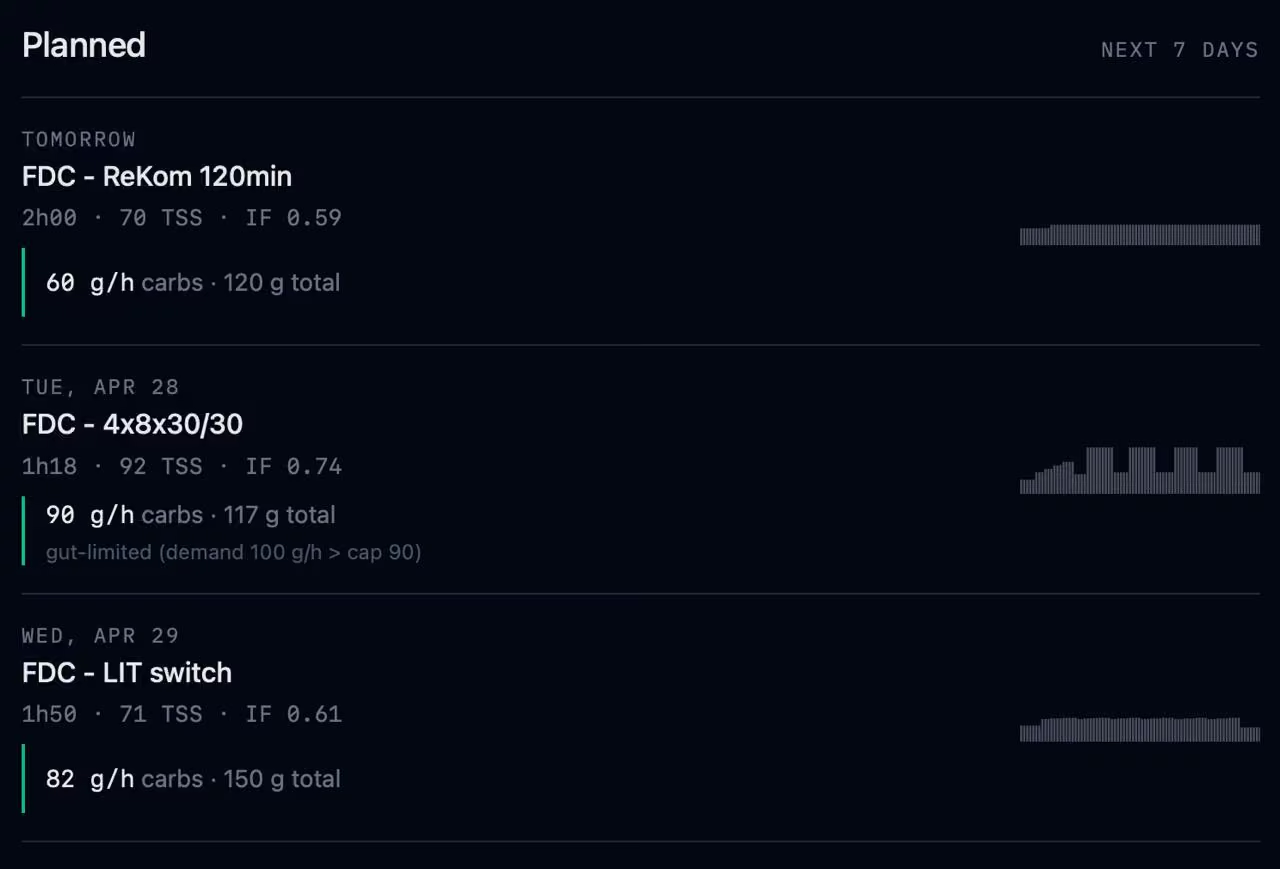
The same numbers show up for planned workouts. If your trainer prescribes a 2-hour recovery ride and a 4×8×30/30 interval session, you see the carb cost before you start. The gut-limited warning only appears when demand exceeds what you can absorb.
If you connect Intervals.icu, the feedback also sees your recovery and form on the ride day. Resting heart rate, sleep score or duration, recovery score, form. Decoupling after a short night looks different than decoupling when you’re fresh. The data is there, the model uses it.
What didn't work
Early versions gave generic advice ("eat 60–90 g/h") when the curve said 120. They said "you faded" on a 4×10min SST where all four intervals hit 209W. They said "flatten your pacing" on Puig Major. They guessed intake when none was provided. All fixed. Not all perfect.
Privacy and how it works
rides.md is local-first. Your FIT file never leaves your browser. Feedback is the one exception, and it asks before it sends.
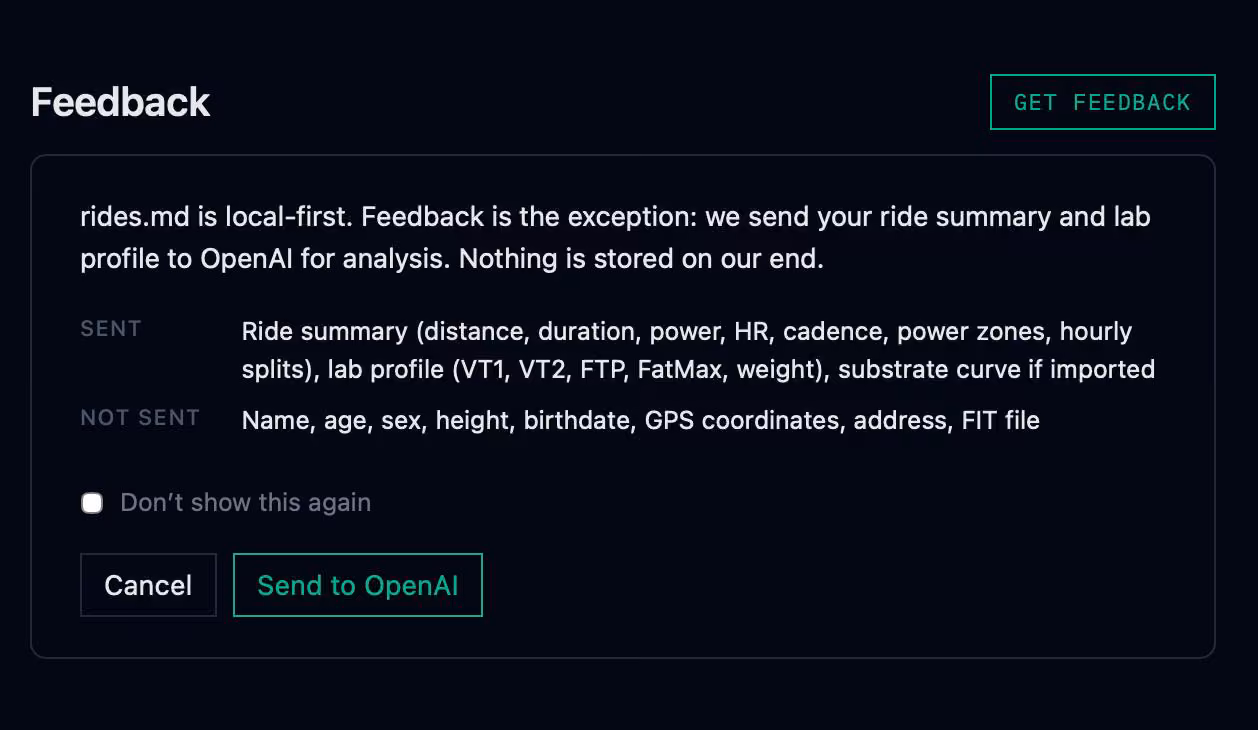
When you click Get Feedback, the ride data goes to an API with a prompt tuned for metabolic analysis. Nothing is stored. No accounts. No analytics. The response is cached locally so revisiting the same ride doesn't call the model again.
Drop a FIT file. Hit the button. See if it tells you something you didn't already know.