Six weeks of fitness and HRV as two sparklines. The shape tells the story.
Badlands is 11 weeks out. I open the rides page and see today's planned workout. I know what I'm doing today. But the question that actually matters is different: am I on track? Is the build working? Is my body holding up?
That's what the new "Form" section answers. Two sparklines, six weeks each, sitting below the race countdown.
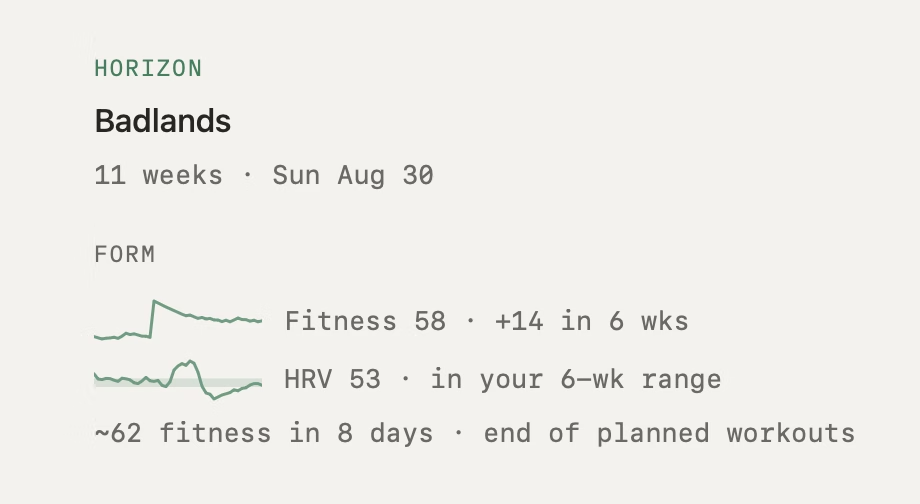
Fitness is CTL — a running average of training load over ~42 days. The number is today's value, the delta is how much it moved since the start of the window. The sparkline shows the shape: steady build, race spike, post-race drain, or plateau. You read the shape, not just the endpoint.
HRV is a 7-day rolling average. Raw daily HRV jumps around too much to read as a trend — one bad night and it drops 15. Smoothing it to a week filters the noise. The faint band behind the line is the middle 50% of your own 6-week range. The label says "in", "below", or "above" your range. No colors, no traffic light. Just where you are relative to yourself.
The two lines read together. Fitness climbing while HRV stays in range means the build is being absorbed. Fitness climbing while HRV slides below range often means you're loading faster than you're recovering. And fitness draining while HRV rises? That's a taper working, the body paying off its debt. Both readings are true at the same time — the juxtaposition is the insight.
After Seven Serpents (528 km gravel race in late May), the fitness line spiked from the race load, then drained during the pause. HRV dipped during the race, rebounded hard in recovery, then settled back to normal. Classic pattern. The sparklines made it visible without me needing to remember when things happened.
The forecast
Below the sparklines: ~62 fitness in 8 days. It reads my actual planned workouts from the intervals.icu calendar, feeds each day's TSS through the CTL formula, and tells me where fitness lands at the end. Not a guess based on recent averages — a projection from the plan I wrote.
If the plan reaches close to race day, it says "by race day" instead. If the calendar is empty, the line disappears. It only shows what the plan delivers — never pretends unplanned weeks are zeros.
The ~tilde stays. Planned TSS is an estimate. The model assumes a 42-day time constant. None of this is precise. But it answers the question I actually have: if I execute this block, where do I end up?
What I learned building it
I started with a raw delta for HRV ("−11 in 6 wks") and immediately hit a problem. After Seven Serpents, the 6-week window started at a pre-race baseline, captured the suppression and rebound, and landed on a perfectly normal value. The delta said −11 and made it look like things were getting worse. They weren't — the shape told a different story.
Switched to range-relative wording. "In your 6-wk range" is honest regardless of where the window starts. The sparkline carries the nuance. The label just says whether you're inside your own normal right now.
For the fitness forecast, I first used the mean of the last 4 weeks' daily load and projected forward assuming it continues. The problem: a single race weekend with 400 TSS inflates the mean for a month, making the forecast optimistic during a pause. Replaced it with the actual planned calendar. Now the number reacts when I edit the plan, shows what a taper costs, and past spikes can't inflate it.