Today is a public holiday in Austria. That usually means one thing: a quiet block for the side project.
I had a few rough edges in rides.md that kept bothering me. The numbers were there, but the page still felt too much like a dashboard. Too many separate things. Not enough flow.
So I worked on the parts I look at before and after training.
The next race belongs above the week
A weekly plan without the next race is missing context. A two hour endurance ride looks different when Badlands is 12 weeks away. The workout did not change. The reason for it is easier to see.
The rides page now pulls the next future race from Intervals.icu and shows it above Planned. Far out, it shows rounded weeks. Inside 30 days, it switches to days. The date stays visible too, because calendar reality matters.
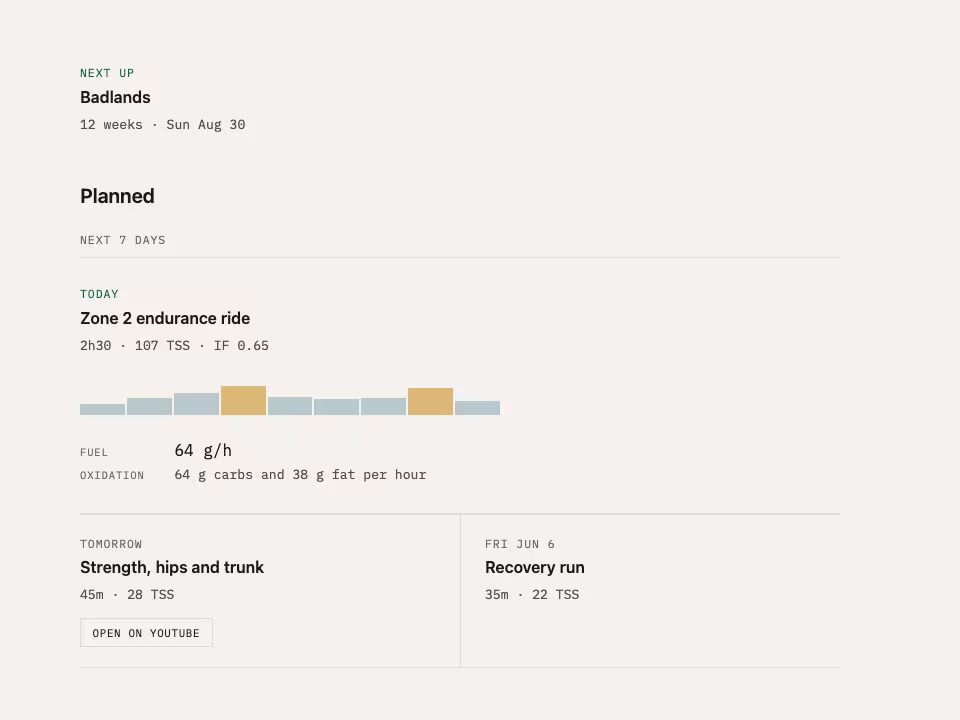
I also moved the weekly label back where it belongs. Next 7 days describes the workouts, not the race above them.
The planned workout has to carry the physiology
The planned card used to behave like a list item with stats attached. That was backwards. The workout is the object. Duration, TSS, IF, profile, fuel, and oxidation are annotations on it.
Now the profile sits with the workout. Fuel sits below it. Oxidation sits below fuel. You can read the session from top to bottom without assembling it from separate corners of the page.
It also shows more than rides now. Strength, runs, swims. If Intervals has a YouTube link for a strength session, it appears there. Small thing. Useful thing.
The surface got quieter
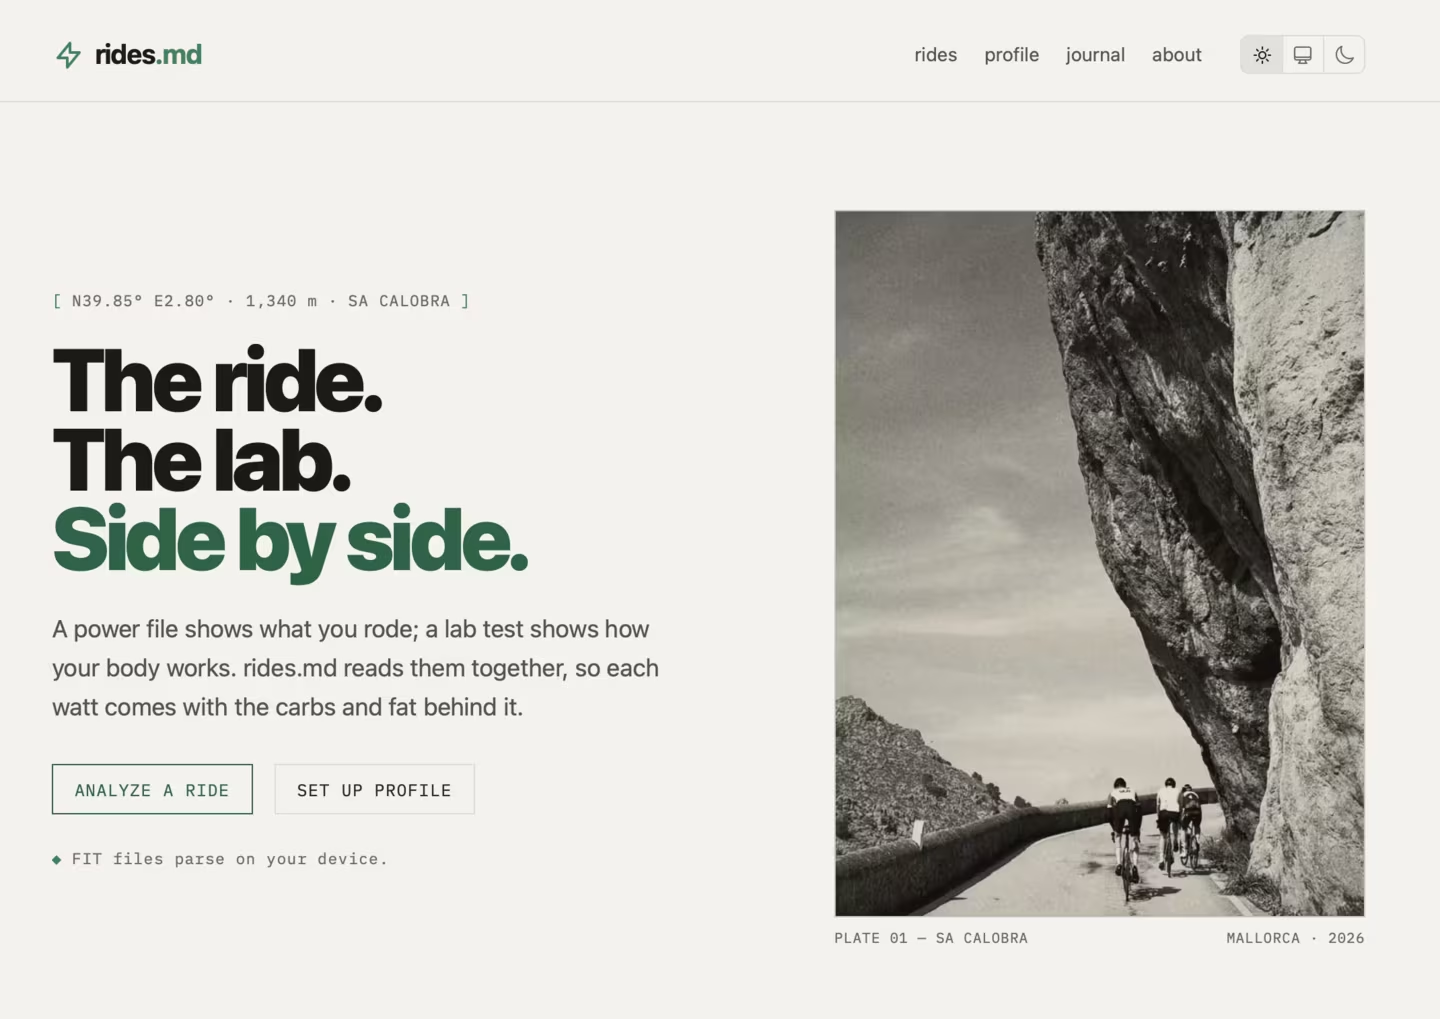
I moved the app to warm paper and ink. Light, dark, and system themes are there now, but the default feeling is paper. A place to read numbers. Not a black cockpit.
The home page got the same treatment. One rail. One visual rhythm. Adventure photos, but not as decoration. They remind me these files come from real days outside, not just files on disk.
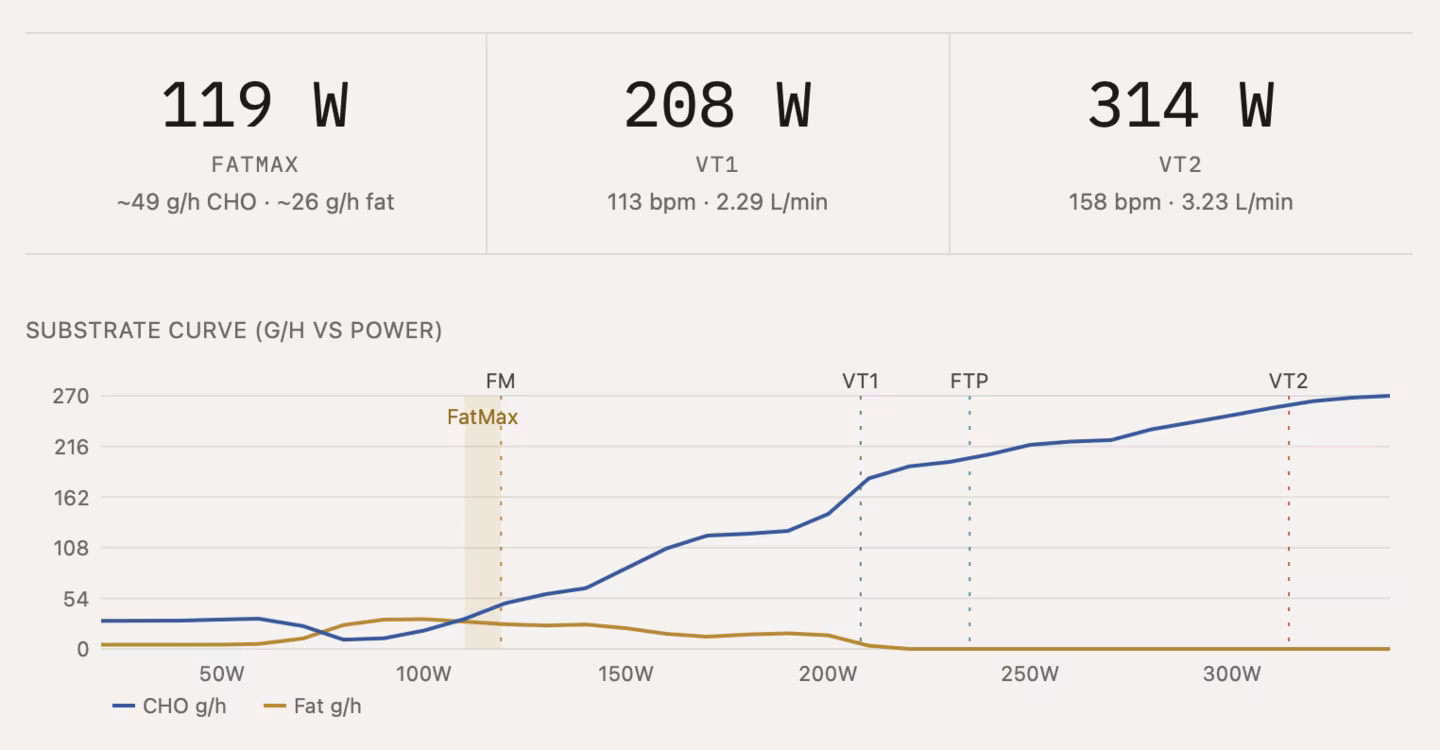
The chart colors changed too. Less neon. More like a printed lab report. The substrate curve, power curve, zones, and map overlays now share the same muted pigment set.
The useful change is not any single screen. It is that the parts are starting to agree with each other. The ride page, the planned week, the profile, the journal. Same rail. Same paper. Same kind of numbers.
Still a side project. Still not finished. But it feels more like the tool I wanted when I started: your ride, your lab, your plan, in one place.