Carb cost on the profile page
The profile page was showing a lot: FTP estimate, Coggan zones, substrate curve, calculated cards. But the thing I kept going back to was simpler. At this power, how many carbs am I burning? Can I replace them?
So I rebuilt it around that.
What I removed
The profile page used to show a standalone FTP estimate derived from VT1/VT2. It was useful internally, but too easy to read as "your FTP." A CPET can inform threshold. It does not hand you FTP.
Gone too: the Coggan comparison table that made the page feel like a zone-conversion tool, and the full lab markdown export. Less comparison. More cost.
What stayed
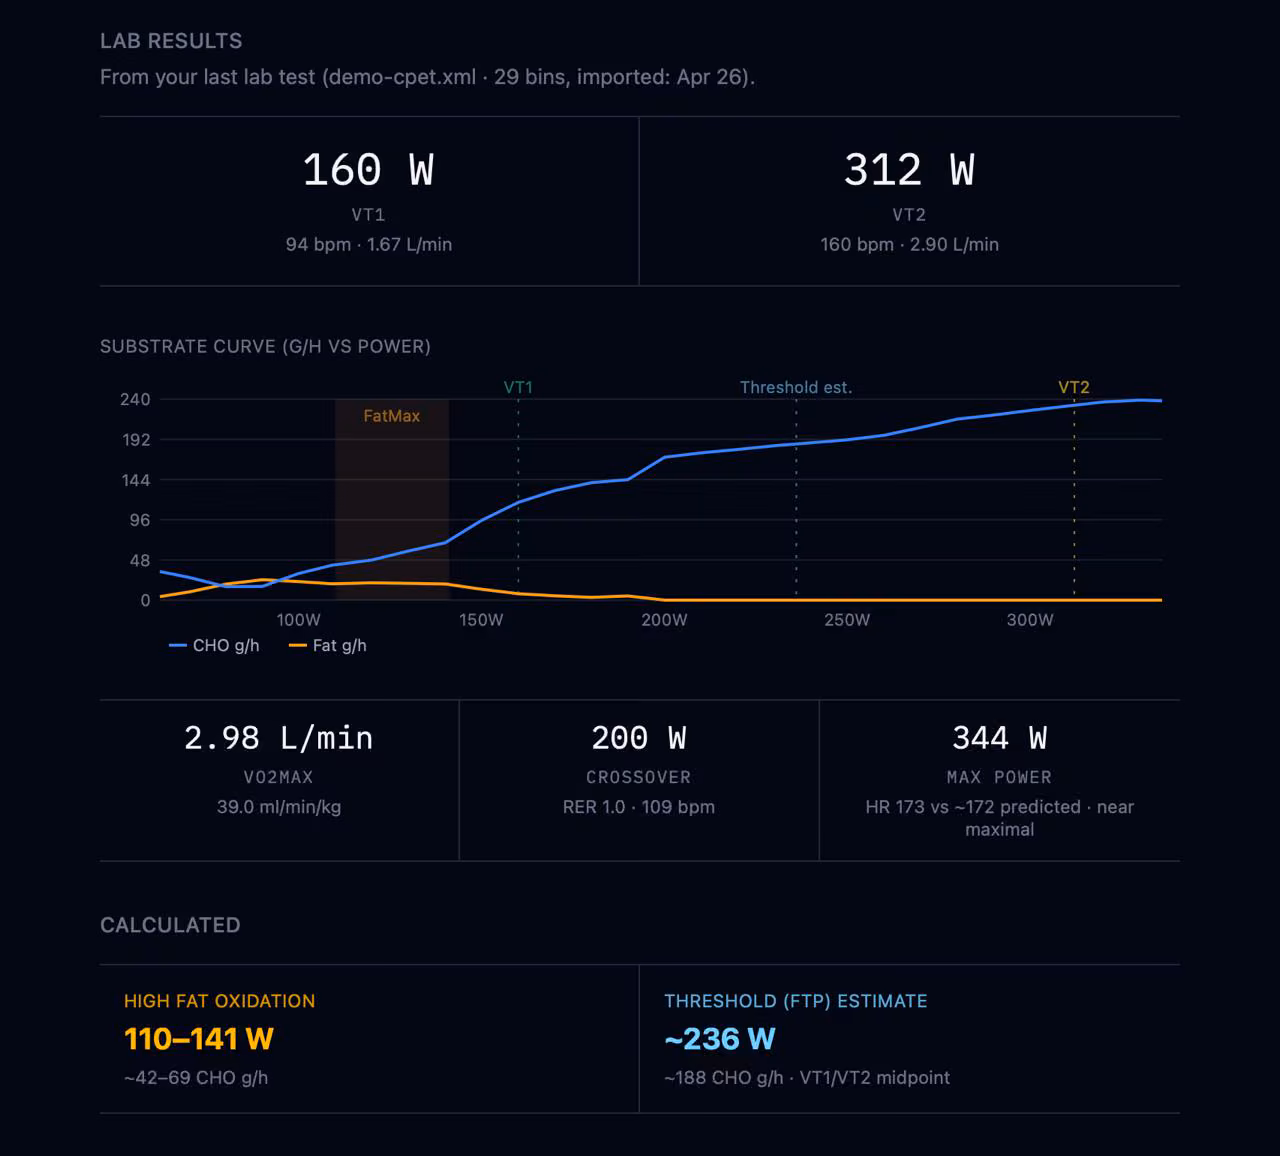
The profile now centers on physiological landmarks from the CPET:
- FatMax — where fat oxidation is near peak. Shown as a range, not one fake-exact watt.
- VT1 — where easy starts to stop being easy.
- VT2 — where the cost curve gets steep.
VO₂max and max ramp power are still there, demoted to a summary line. They are interesting. They do not tell you how to fuel a 3-hour ride.
Carb fuel balance
This is the biggest change. Instead of just showing landmarks, the profile now shows the cost at each one:
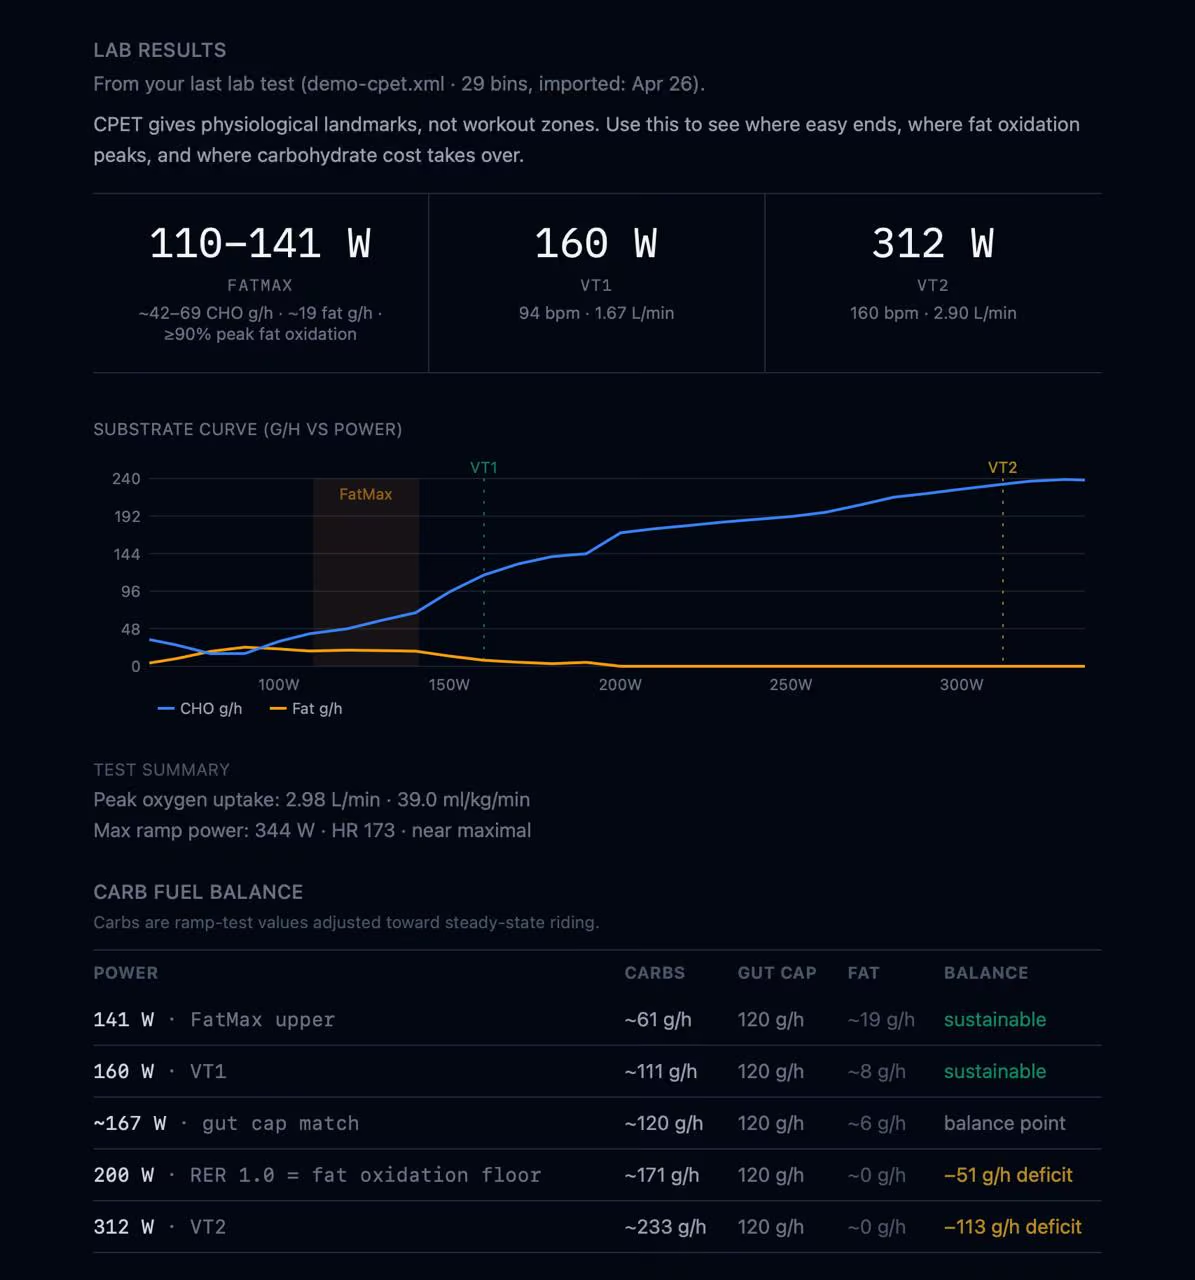
Five rows. Each one a landmark with the carb cost, gut cap, fat contribution, and balance.
- 141W · FatMax upper — 61 g/h carbs, 19 g/h fat. Sustainable.
- 160W · VT1 — 111 g/h carbs, 8 g/h fat. Still sustainable, barely.
- ~167W · gut cap match — the wattage where carb demand equals what the gut can absorb. Below it, you can roughly replace what you burn. Above it, you are spending stored glycogen.
- 200W · RER 1.0 — fat contribution is basically gone. 171 g/h carb demand, 51 g/h deficit.
- 312W · VT2 — 233 g/h demand. 113 g/h deficit. The cost is steep and the clock is ticking.
At this power, can I replace what I'm burning? That's what the table answers.
The gut-cap match point
This is the wattage where modeled carb demand roughly equals gut absorption capacity. Below it, intake can keep up. Above it, you are drawing down glycogen.
For my numbers, that point is ~167W. Which means: anything above VT1 is already borrowing. On a long ride, that math compounds.
Modeled carb demand
The carb numbers come from the ramp-test substrate curve. Ramp tests are not perfect steady-state fueling tests, so the table treats them as modeled fuel cost, not a direct eating target.
Why this is better
It connects lab physiology to ride decisions. Below gut cap match: mostly replaceable. Above it: glycogen draw. At RER 1.0: fat is gone. At VT2: the cost is high and fueling alone won't fix it.
That's what I wanted the profile to show. It's not finished. But it's closer.